lolbench: automagically and empirically discovering Rust performance regressions
lolbench compiles ~350 benchmarks with every Rust nightly. It then runs them and highlights potential performance regressions in the standard library and the output of the compiler. Each toolchain's run is summarized with a list of likely candidates, as seen in the image below, and we're now getting started using these to safeguard the performance of Rust programs. Come help!
I've been working on what you could call a performance regression test suite for generated Rust binaries, made up of "in the wild" Rust benchmarks that are instrumented, built with many different compiler versions, and run while being measured across a number of dimensions. The test suite also includes tools for determining which benchmark runs are anomalous or interesting.
And, to my extreme surprise, IT SEEMS A LOT LIKE IT WORKS. It's called "lolbench" because I needed a placeholder, but now I've been working on it for too long without thinking of a better one so it's the name. You can visit the website summarizing the results if you want to take a peek.
If you don't have time to read this but the project sounds interesting to you, come help! A few ways:
- Help shrink this list of benchmarks we'd love help porting. The README has instructions for adding new benchmarks.
- Do you have code that was made slower by a previous release of Rust? Did you know that software engineering research suggests that once you have seen a bug a couple of times that the likelihood of seeing it again goes way up? Send a PR to keep that from happening!
- There are a ton of ways to improve the runner infrastructure, analysis quality, and reporting website. There are a bunch of issues documenting some of these at the GitHub repo.
I've been posting about my progress in the #wg-codegen channel on irc.mozilla.org as anp, and am more than happy to chat there!
Identifying potential regressionsahoy
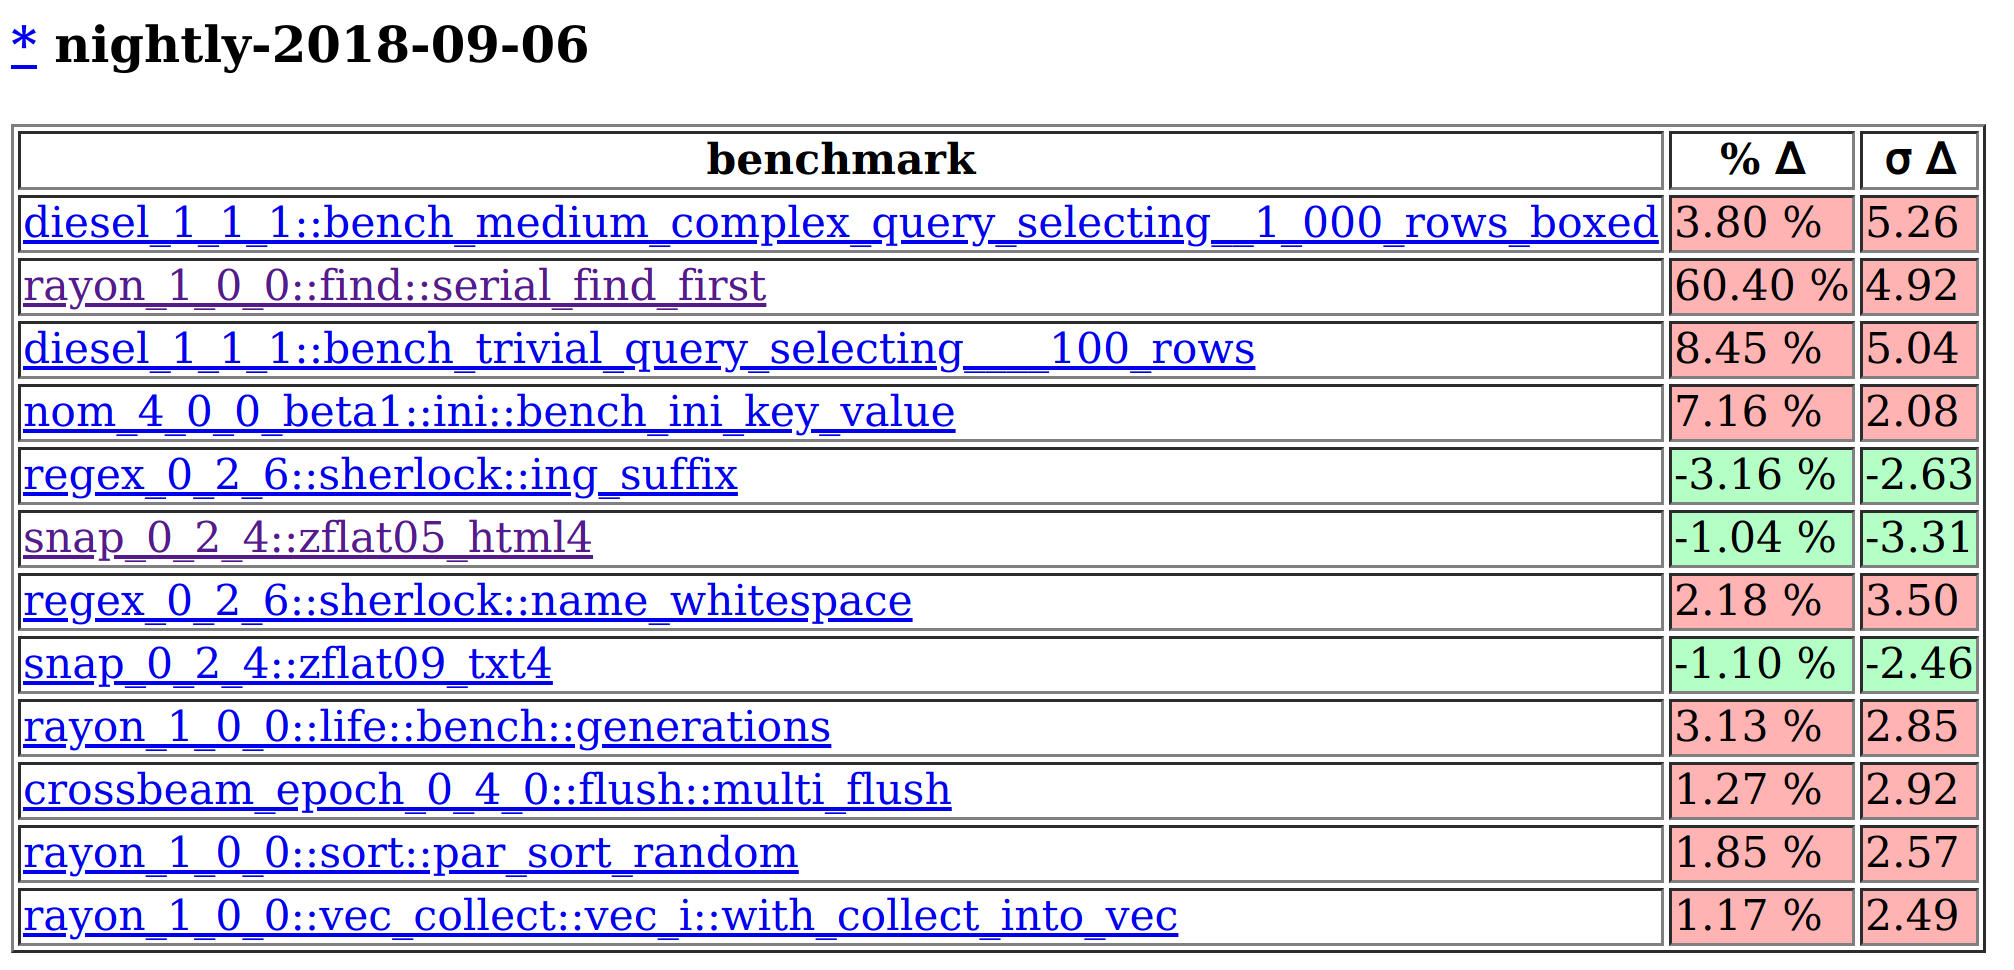
If we go to the website generated by lolbench and scroll way down the list of potentially anomalous results to early September 2018, we'll see something like this:

This tells us that the rayon_1_0_0::find::serial_find_first benchmark had a runtime using the 2018-09-06 toolchain that was 60% longer than the mean runtime for all toolchains we'd recorded before that. This represents a change nearly 5 standard deviations from the mean, so it's pretty significant and definitely worth checking out!
Let's click on the benchmark name, although you may notice from my lazy screenshot that I've already done so. We're greeted by something like this, albeit without the super helpful rectangle to tell us where to look (TODO):
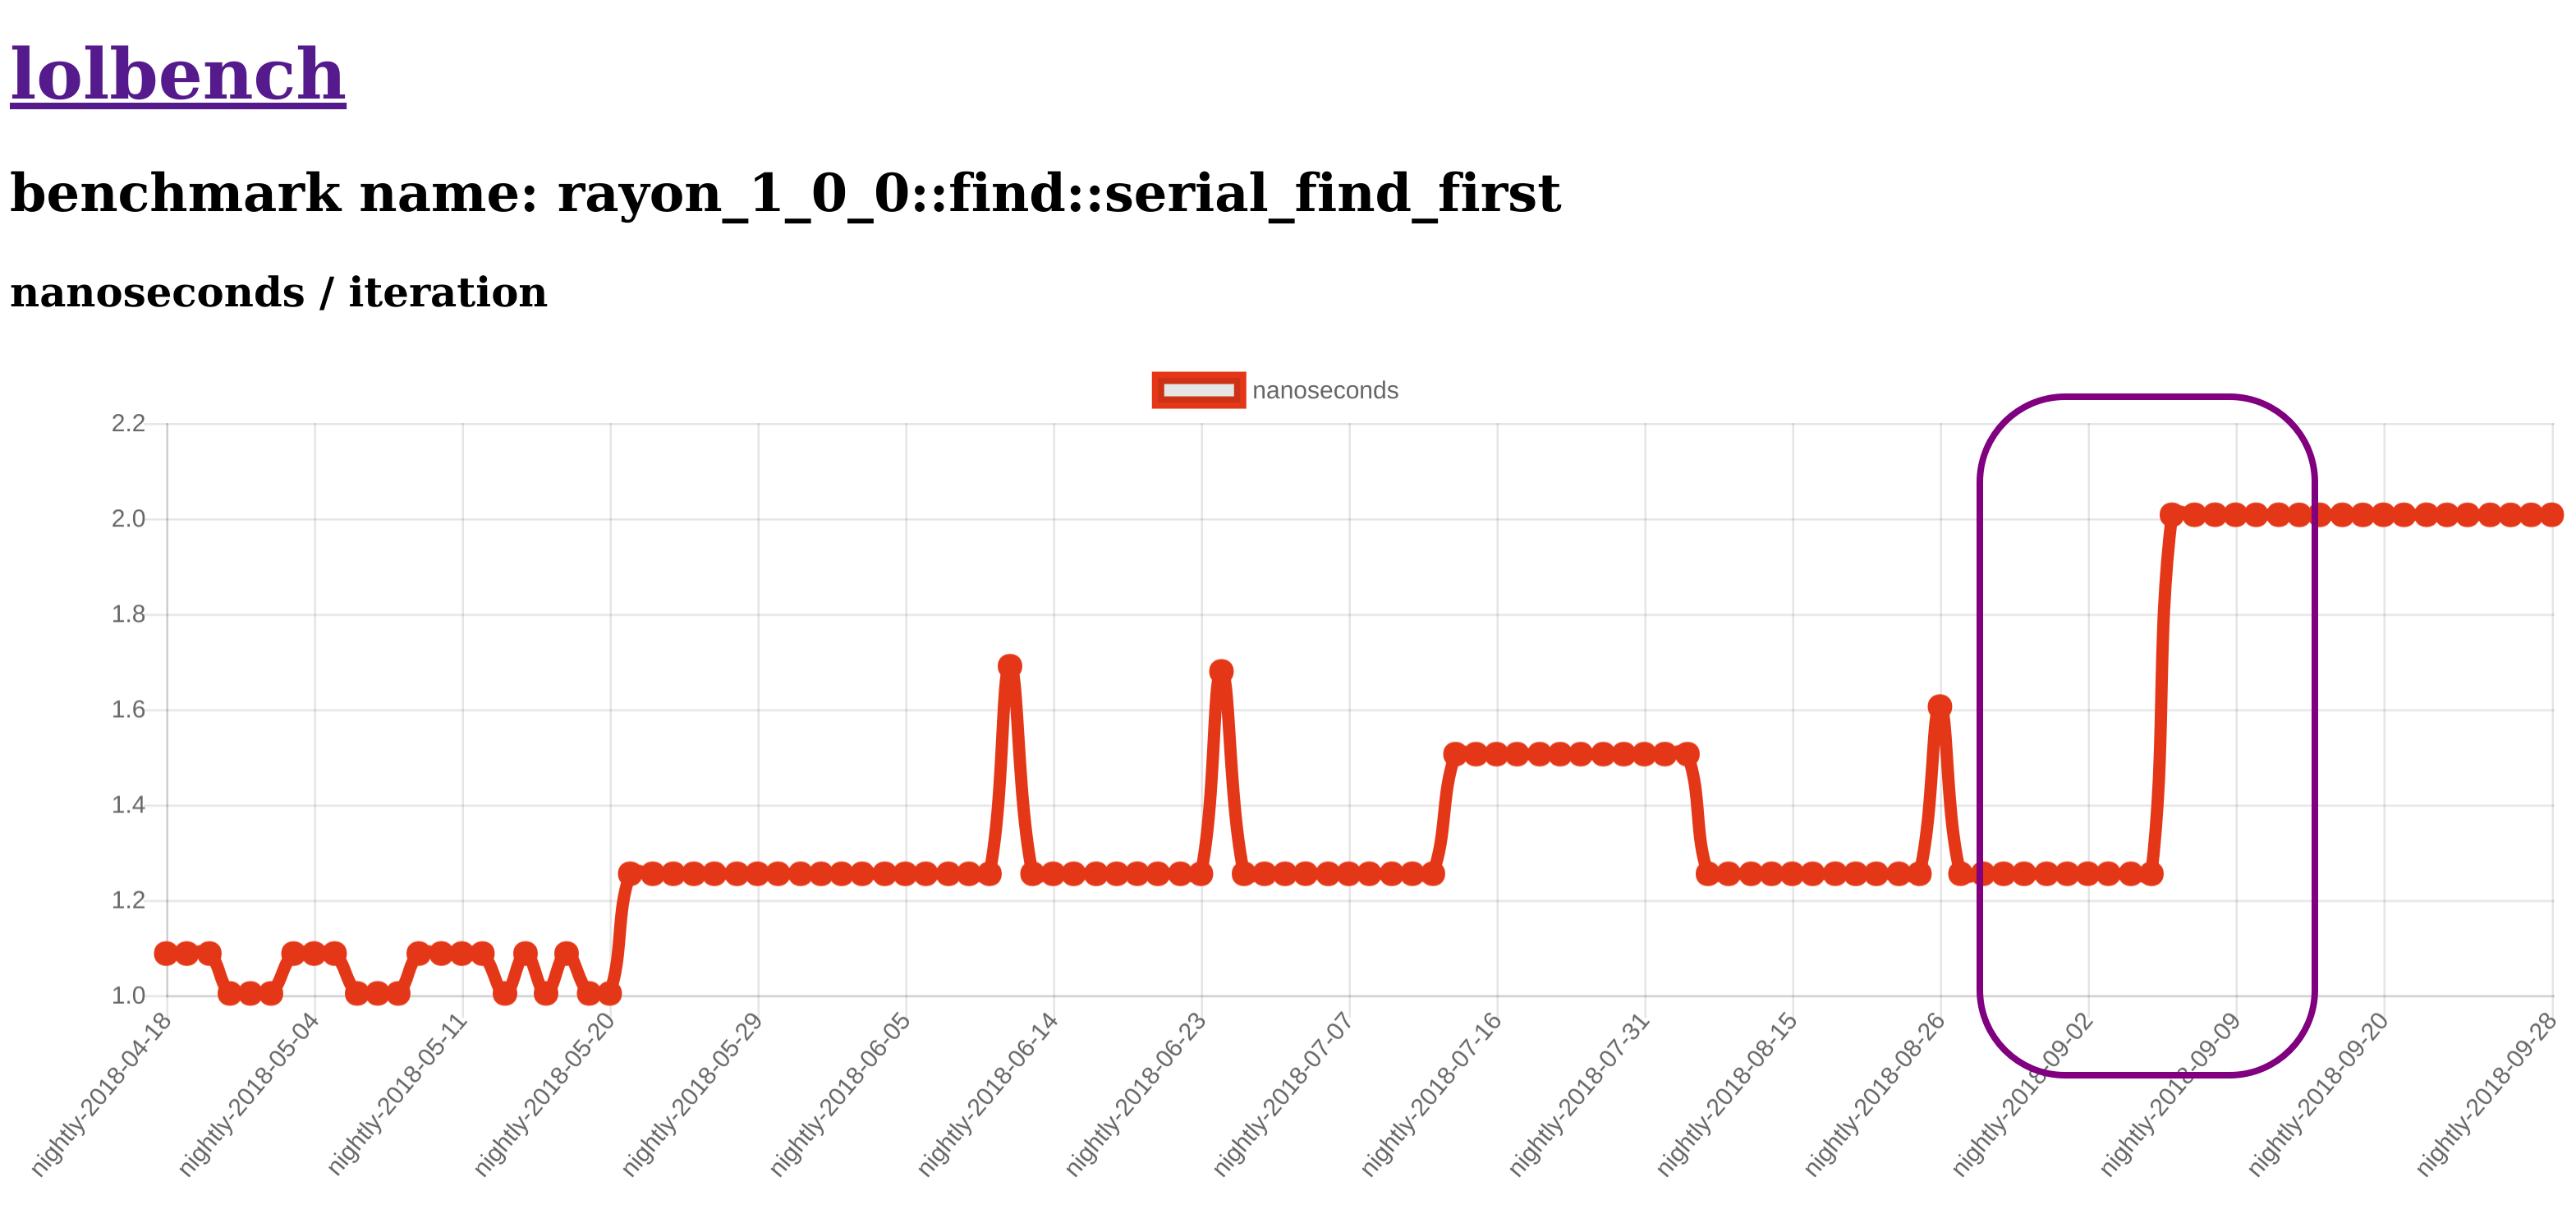
It looks like some interesting runtime changes have happened to this benchmark over time, the most obvious of which is the most recent regression that appears to have happened in the 2018-09-06 nightly. If you look further down that page, you can also see other metrics we collect, like the instruction count, number of branch & cache misses, and others. In my experience, having supplemental metrics that help you root-cause a perf change is very very useful. However this regression was so obvious that it didn't seem worthwhile to analyze the other numbers.
Bisecting the apparent regressionahoy
We want to know the exact commit which caused a problem for a few reasons. It's usually best to understand as much as possible about a performance measurement before acting based upon it, and constructing a plausible narrative backed by evidence is one of the clearest paths to being confident in any changes we make based on our discoveries.
Focusing in on the 09-06 nightly, there are a few commits that are candidates for having caused this. In the hopefully near future lolbench will be able to run benchmarks for every PR merged to master, but for now we'll use a tool called cargo-bisect-rustc to find the exact commit introducing the slowdown. Here's the command I ran to bisect this regression:
❯ cargo bisect-rustc --by-commit --start 2018-09-05 --end 2018-09-06 \
  --prompt --preserve-target --test-dir benches/rayon_1_0_0/ \
  -- run --release --bin find-serial-find-first
Breaking this down a little:
--by-commitsays to parse nightly dates from ourstart/endflags but to still run our command for every merge commit between them.--promptsays to let us manually decide whether each benchmark result is a "baseline" result or a "regressed" result, which is important for assessing the outcome of what is typically a very noisy stochastic process. We can also choose to retry the command multiple times if we'd like to further convince ourselves we're seeing an accurate measurement.--preserve-targetsays to preserve the target directory for a given toolchain across runs. Normally cargo-bisect-rustc is used for testing things where you want to re-run the compilation for every attempt and so the target directory is cleaned between runs by default. With benchmarks I'd usually rather save time and assume that the compilation will succeed with a result that is stable. If so, we don't need to recompile the binary for each retry.--test-dirsets the current working directory for the cargo subcommand which is passed after the bare--, which is also where the rust repo is cloned if necessary and the target directories for each toolchain are created.
Here's what it looks like to run it, assuming your starting directory is an up-to-date checkout of lolbench. I've slightly doctored the recording to remove the "downloading rustc/std" phases output, because they made the download yuuuge for no significant value. I also didn't include any retries here, but in practice I usually run the benchmark on each toolchain 3 times and write down the results so I can be more confident when deciding whether the numbers I see are actually regressed for each commit.
>We end with a line like so:
regression in f68b7cc59896427d378c9e3bae6f5fd7a1f1fad9
Some amateur git sleuthing:
❯ git show f68b7cc59896427d378c9e3bae6f5fd7a1f1fad9
commit f68b7cc59896427d378c9e3bae6f5fd7a1f1fad9
Merge: 1c2e17f4e3 e1bd0e7b4e
Author: bors <[email protected]>
Date:   Wed Sep 5 00:37:03 2018 +0000

    Auto merge of #53027 - matklad:once_is_completed, r=alexcrichton
...
So now we know the likely cause of the issue -- a PR changing std::sync::Once, a very widely used synchronization primitive.
Constructing the narrativeahoy
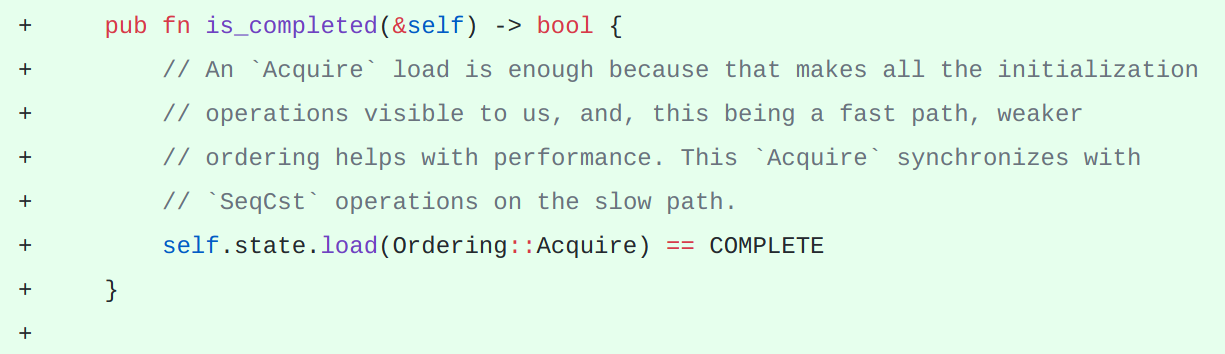
Pull request #53027 added a new unstable API to Once by refactoring identical branches from separate methods into a new method which is also publicly exported. Here's the essence of the change. Extra mega bonus points if you can guess without reading the PR comments or skipping ahead what deoptimization occurred here, and all the points if you can guess why that happened.
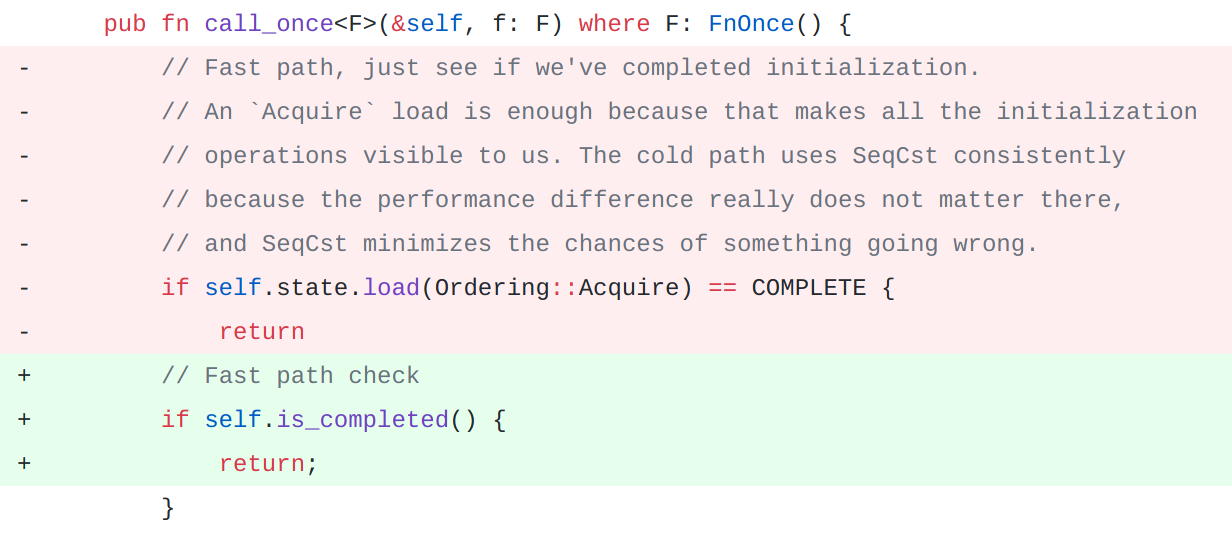
My intuition was that the new method failed to inline, resulting in a failure to optimize away an extra branch and call. Presumably that's enough to cause a 60% regression on a benchmark that is at a stable baseline timing of 1.0-1.3 nanoseconds on my current hardware.
If you're not familiar with compiler internals or optimizations, no worries! Although the next few paragraphs are going to be dense.
Inlining is a "gateway" optimization in the sense that it is important because it allows the optimizer to unlock further improvements by reasoning about the caller and callee functions together at the same time. In this case, moving the equality check into a separate method technically creates two branches: first to see if self.state == COMPLETE, then to check whether self.is_completed() == true. Inlining self.is_completed() into call_once allows the compiler to prove that the two branches are equivalent and to combine those checks into a single one. Overall, inlining is incredibly important for performance in Rust programs as it must happen before any of Rust's very tall tower of abstractions can be collapsed into an efficient implementation.
However, I was initially confused by this hypothesis because I missed the fact that we probably failed to inline is_completed into an exported generic method. eddyb pointed this mismatch out, which made it clearer why that happened. Even though the is_completed method is definitely small enough to be inlined by LLVM under normal circumstances, generic methods like call_once aren't optimized and compiled until they've been "monomorphized," or a specialized version has been created with concrete type(s) replacing the generic placeholders. In the case of generic methods and functions that are exported from their defining crate, that means that they're monomorphized, optimized, and compiled during compilation of the consuming or "downstream" crate. Further, in Rust, cross-crate inlining of non-generic functions and methods is currently only supported when they're explicitly annotated with the #[inline] or #[inline(always)] attributes. I'm told by informed parties that this requirement may be easier to lift when MIR-only RLIBs land, but for now it's the case.
The end result of this is that if you extract code from the hot path of an exported generic function or method to put it in a non-generic function or method, you may end up inhibiting optimizations that were previously occurring. Which is what appears to have happened in this case. While the impact is very very very tiny, this primitive is really common in the ecosystem. And every little bit counts when it comes to achieving the aspiration of being the fastest language which (capital-O Opinion) is still really nice to use!
Ultimately, I chose to focus on reporting this change for this post in part because catching death-by-a-thousand-cuts-style regressions like this one is an area where I hope lolbench can excel over time compared to the current state of the art, but also because it's simple enough to fit as both a test flight for the project and a case study for this post.
Reporting-ishahoy
Of course, I had planned to roll out the red carpet with a nicely formatted little report in a fresh GitHub issue to justify the need for a follow-up (something I might like to sort out a little automation for since perf bug reports have many things in common), and eddyb left a comment on the issue as I was headed to bed. Because this was a simple fix, it would seem that no one felt compelled to ask for numbers and there's now a PR in the merge queue to fix the regression. As I write this, the PR hasn't landed yet, which means that lolbench hasn't run the benchmarks for a nightly containing it yet. I also haven't yet written the code to easily point lolbench at an unmerged PR to test.
But it would be really nice to brag about how awesome this whole thing has been and how it's all buttoned up. What's that, you say? You, dear reader, would kindly accept some sort of substitute proof in the meantime? OK, let's see if I can validate this change on my machine locally.
(Definitely Not Ego) Validationahoy
We'll measure the benchmark here three times: once each with nightly-09-05 and nightly-09-06 to provide context for the hardware I'm using, and then once with a toolchain built from the current tip of master with the follow-up PR's fix applied. The local toolchain here is my working copy of Rust with the following patch applied:
diff --git a/src/libstd/sync/once.rs b/src/libstd/sync/once.rs
index ce54726bae..17cb614ba1 100644
--- a/src/libstd/sync/once.rs
+++ b/src/libstd/sync/once.rs
@@ -330,6 +330,7 @@ impl Once {
     /// assert_eq!(INIT.is_completed(), false);
     /// ```
     #[unstable(feature = "once_is_completed", issue = "42")]
+    #[inline]
     pub fn is_completed(&self) -> bool {
         // An `Acquire` load is enough because that makes all the initialization
         // operations visible to us, and, this being a fast path, weaker
Here's where we end up:
❯ for toolchain in nightly-2018-09-05 nightly-2018-09-06 local
      echo "running benchmark with $toolchain"
      echo
      cargo +$toolchain run --release --quiet --bin find-serial-find-first | grep 'time:'
      echo
  end
running benchmark with nightly-2018-09-05

                        time:   [1.2689 ns 1.2727 ns 1.2783 ns]

running benchmark with nightly-2018-09-06

                        time:   [2.0291 ns 2.0326 ns 2.0370 ns]

running benchmark with local

                        time:   [1.3047 ns 1.3064 ns 1.3083 ns]
The middle numbers on each line are criterion's best estimate for the median runtime of the function, with the left and right numbers representing the 95% confidence interval around that estimate. In other words they're an attempt at reasonable error bars, and none of the error bars for the three measurements overlap which is a good sign that our measurements are reliable.
Looks to me like this fix recovers nearly all of the performance loss! We'll have to see in a couple of days whether lolbench agrees. In the future I'd like to dig into the exact codegen changes which leave that 0.3ns on the table, but I think that's an investigation for another day :).
You promised to talk about why this problem is importantahoy
That's neither a suitable heading for a blog post nor a question, but yes, thank you for the reminder.
An old nemesis, revisitedahoy
In January 2016, Rust 1.8 was the current stable release, and I like to think that Niko Matsakis, leader of Rust teams and virtuoso compiler hacker, was at a more innocent time in his life than today. I certainly was. He posted a GitHub issue, saying:
We need a benchmark suite targeting the runtime of generated code.
After reading that, I wrote a couple (reddit thread 1) of posts (reddit thread 2) detailing my efforts to collect some benchmarks and identify clear performance changes in binaries produced by different nightlies. The data were far too noisy to build automation and process around. Then, about two years after his first post, Niko posted to irlo this February asking for help resuming work on the project and getting the results onto perf.rlo. I'm such a sucker. Thankfully, I was also a sucker who had learned a bit more about how computers work in the meantime.
Just get the manifesto over withahoy
Rust is a Fast Programming Language. Rust programs are therefore "fast," especially so if you write them with the correct observations to the arcane ley lines of birth and death known as "lifetimes," and also remember to pass cargo the --release flag. Without getting bogged down in what exactly "fast" means, it's a generally accepted cultural value in the Rust community that code provided to rustc should result in "fast" programs. And, as a matter of course, that if you upgrade your compiler in the sesquilunar ritual, the compiler should produce programs at least as "fast" as it did before.
Also a value in the Rust community, the Not Rocket Science Rule of Software Engineering:
automatically maintain a repository of code that always passes all the tests
This is an approach to testing which has served the Rust project extremely well in many ways, and in my opinion execution on this approach has been a really significant factor in Rust's success to date. See brson's post about testing the Rust project for more details, although note that the info there is about a year old as of writing.
In the interest of preserving and advancing Rust as a Fast Programming Language, might we further propose that the project also adopt the "More Like Rocket Science Rule of Software Engineering"?
automatically maintain a repository of code that always holds constant or improves all the benchmarks
This is, for a litany of reasons, really really hard. Or, as I am told professionals say, quite challenging.
OK, maybe we could try for the "A Little Bit Like Rocket Science Rule of Software Engineering"?
automatically maintain a repository of code where you are always notified if benchmark performance degrades
This is an analog to the "you can't manage what you don't measure" aphorism and is implemented today for compile times in the form of perf.rlo, which measures compile times for a number of projects using compilers built from every merge to master. There's an accompanying bot that can also be invoked on a PR before it is merged to see what effect the changes may have to downstream compile times.
Have I mentioned that precisely and accurately measuring small benchmarks is really complex? Especially these days with all these new fangled things like "the memory hierarchy," "pseudo random number generators," "input/output," and "multiprocessing."
So how is it done?ahoy
I originally intended to write a very lengthy section here to describe a number of the challenges and mitigations we take as part of producing these results. However, in publishing a draft of the post I accidentally included the draft in the RSS feed for my blog (oops! since fixed) and now it's being read by a bunch of people! Exciting!
Instead of hurrying around trying to fix the whole thing, I'm going to postpone this section and write some technical docs for the project. I'll blog more once I've done so. If you simply can't wait to learn more about the efforts lolbench takes to produce accurate data, in the meantime you can watch a talk I gave about it in May. The recording quality isn't the best, but I think it still has some good content.
Rust is Us, Rust Must Be Fast, We Must Be Fastahoy
Come, quickly! Come help! It's taken me quite a while to put this together, and it's barely begun. Now that we have this started and running continuously, we need to get more data, understand the data we have better, and start triaging and fixing performance regressions that affect the community.
In the near future, I hope we'll be able to run lolbench for every merge to Rust, not just nightlies, add many more benchmarks as we discover different types of code coverage we need, and refine the analysis and reporting to prevent missing regressions and to minimize unnecessary triage work from false positives.
In a future I have dreamt of only in fevers, lolbench is able to automatically cross-validate likely anomalies across multiple benchmark runners, able to run benchmarks using a variety of potential compiler flags and compare across those, able to automatically notify us if two benchmarks are statistically equivalent and we can disable one, able to produce heap allocation stats and flamegraphs for each benchmark function, etc etc etc.
If this sort of stuff interests you, come check out the open issues on the repo or ping me on IRC -- I'm anp in #wg-codegen on irc.mozilla.org. I'm super excited to hear from you!