Rust Performance: A story featuring perf and flamegraph on Linux
Gaining some performance wins in a Rust program with a 7 line diff, using cargo bench, perf, and flamegraph on Linux.
Contextahoy
I'm working on a Rust program which does intensive analysis of hundreds of gigabytes of data. This last week I spent a couple of days working on improving runtime performance, and eventually hit a wall. There already exist several good blog posts on profiling Rust which I've referenced in the past several times, but none of them quite covered what I wanted to do here: use perf + flamegraph. I'd heard from several people that perf is an amazing tool (and it is!), and flamegraphs look cool and seemed useful.
This is a long story of learning to do that. If you haven't done profiling with Rust, hopefully this account can serve as an example when you need to do so next. There are also some not-entirely-intuitive things I found in the course of the investigation.
The programahoy
The program I'm working on at $DAY_JOB does analysis of "metagenomic samples" (DNA sequences collected from mixed biological samples). It makes use of several data structures which are common to bioinformatics applications, and thankfully the rust-bio crate already does most of the heavy lifting here (cue obvious segue for later). This program is quite fast, but not yet fast enough.
Testsahoy
Before the obligatory "measure all the things" blurb, I think it'd be disingenuous in a performance post to not point out that having automated tests is invaluable when making non-functional changes. When you have a test suite you can trust to tell you your changes are correct, it's possible to move swiftly on performance improvements.
Measure, measure, measureahoy
It's obviously very important when working to improve any metric (like runtime) that one measures the impact of one's changes. Especially when relying on optimizing compilers, which are all descended from some family of fickle eldritch beasts. Obvious changes like, "I'll condense these two branches into one check" or "I'll remove the bounds check for this array access" may appear to you to remove the number of calculations performed, but can also end up hiding important information from the optimizer thereby hurting your overall performance. They might also make your program wicked fast, so while I'm not an expert, I am confident saying that you must measure everything you do to affect performance. And don't just use /usr/bin/time -v, although that's a start.
I built some basic benchmarks to run using nightly Rust's benchmark runner. It does some statistical work to run a benchmark enough times to have a good idea of its actual runtime, and it handily provides a measure of the variance it encountered while doing so. In the course of writing this, I noticed a cool post pop up on my Twitter feed about the importance of tracking confidence intervals as you measure your benchmark results. This is something that Rust's benchmark tests make a decent effort at doing, although I generally still invoke cargo bench multiple times to ensure that things are staying within the range reported. Thankfully benchmarking in Rust isn't subject to a JIT or other VM magic, which makes collecting stable results much easier.
Once you've written some benchmark tests (see the Rust book linked above for a good guide, and as an example here's one I wrote for rust-bio), you need to run them using a nightly compiler as of July 2016. Thankfully, using rustup, it's very easy to use a nightly compiler for running benchmarks (or clippy), while still using a stable compiler for day-to-day development:
$ rustup run nightly cargo bench

... cargo builds your dependencies
... cargo builds your benchmarks
...
...
... cargo is still building your benchmarks
...
... cargo starts running your benchmarks
... cargo skips some non-benchmark tests

Running target/release/distance-76e9e0fb6e8adddc

running 5 tests
test bench_hamming_dist_equal_str_1000iter   ... bench: 3,042,154 ns/iter (+/- 102,699)
... and so on

test result: ok. 0 passed; 0 failed; 0 ignored; 5 measured
Ta-da!
As I said, when I first started working to improve the runtime of this program, I wrote a couple of micro-ish benchmarks, and everything was going great. I would make a change, start the benchmarks, wait 20-30 minutes, and see whether some numbers went up or down. Fantastic! I made a lot of progress doing this.
Hitting a wall and doing betterahoy
Then a few problems happened. For one, 20-30 minutes is a looooong turnaround time to find out if your 5 byte diff had a meaningful impact on the performance of your program. For another, I ran out of obvious changes to make. Once you've fully excised calls to clone(), are doing everything conceivable in parallel, have trimmed any non-essential checks and calculations, what to do? Well, figure out where time is getting spent. This is relatively easy when you can just timestamp log entries and do a little "printf-profiling." Not so easy when processing many millions of inputs, each of which processes in little enough time that your logging timestamps won't matter.
Next, I set up my benchmarks to work with perf and flamegraph, so I could figure out where the most time was being spent, and subsequently build a faster-but-still-useful benchmark for just those functions.
Setting up Rustahoy
If you've been following along with my sporadic pseudo-examples, you probably have rustup installed and a nightly Rust downloaded, and you probably also have some benchmarks written to run with the Rust benchmark harness. As mentioned above, you'll also need debug symbols in your binaries if you want to use perf. The normal way of doing so (omitting the --release flag from your build) won't work for two reasons:
- We usually care about the performance profile of optimized binaries
cargo benchbuilds your project with the--releaseflag enabled behind the scenes
So, temporarily add this to your Cargo.toml, or modify your existing release profile:
[profile.release]
debug = true
You may also need to add lto = false to your release profile, I've encountered a few problems with trying to use LTO at the same time as having debug symbols enabled.
perfahoy
perf is a nifty tool for doing sampling-based profiling of a Linux process. There's an alright tutorial on the wiki, and Brendan Gregg has also produced some very nice learning materials. If you're here to learn how to use perf with Rust, you can follow these basic steps and then go to those links to learn how to really do it for your (probably more advanced) use cases.
Basically, my uses of perf have involved:
- Running my program with
perf recordto sample its execution - Analyzing the results using a combination of flamegraphs,
perf report, andperf annotate
There are a bunch of other nifty things perf can do, like tracking specific kernel events, counting cache hits/misses and other stats, profiling JIT behavior (like in the JVM or V8), and probably others. However, in my limited experience, most of the time if you're doing CPU profiling you just need to get an idea of where time is being spent and why.
Flamegraphsahoy
A flamegraph is a really nice visual way to represent the CPU time (or other resource usage) of a program. If you're following along, I'm assuming that you've installed perf, and have also put the flamegraph scripts somewhere in your PATH.
Say you want to quickly visualize where a program is spending time. Say this program is a Rust benchmark test hypothetically named magic_bench and that it contains a function called magic_bench that you care about. You might run some commands like so:
Build our benchmark executable without running it:
$ cargo bench --no-run
Run it through perf, and only run the benchmark we care about (make sure to include the -g option, which enables call-graph recording -- a must for flamegraph):
$ perf record -g target/release/magic_bench-* --bench magic
Let's build a flamegraph of the overall program:
$ perf script | stackcollapse-perf | flamegraph > flame.svg
If we open up flame.svg, we'll see a very handy visualization of CPU time spent in different function calls. Horizontal space corresponds to percentage of the parent's execution time spent in the given function.
However, in my particular case, the benchmark had to initialize a very expensive index before it can execute any of the queries for the benchmark, and this took up something like 98% of the benchmark's runtime, reducing the usefulness of the whole-program flamegraph.
A super nifty part of the stackcollapse scripts for flamegraph is that they let you grep for functions matching a pattern. Protip: all Rust benchmark harnesses invoke a closure like so: bencher.iter(|| do_measured_thing()), easily allowing you to grep for calls to closures to limit the flamegraph to mostly your benchmark's inner, non-initialization loop:
$ perf script | stackcollapse-perf | grep closure | flamegraph > flame.svg
This produces a flamegraph like so, where the loop of the benchmark itself is the main attraction:
Fun story: do you see the two boxes in the second-from-the-top row which aren't even big enough to have labels? Yeah, that's where I'd spent about a day making improvements before I started profiling in depth. Measure, measure, measure.
Improving turnaround timeahoy
So, I've found out that the vast majority of time I spend querying these data structures ends up in a library call: bio::data_structures::bwt::Occ::get. If I can write a fast benchmark for this function (and friends), I can probably iterate a little more quickly on trying out various improvements. So I did!
And here's the flamegraph of that benchmark's closure, just to confirm that it's profiling somewhat similarly to the much longer running benchmark from my application:
$ cd ~/rust-projects/rust-bio
$ cargo bench --no-run && \
    perf record -g target/release/fmindex-* --bench seed && \
    perf script | stackcollapse-perf | grep closure | flamegraph > flame.svg
Resulting in:
Diving deeperahoy
With the command above, we generated a flamegraph, but in the process perf also saved a big honkin' data file we can use for further analysis without having to rerun our benchmarks. perf has some nice TUI and GUI explorers for profiling data, so for example, we can run perf report to get a keyboard-navigable hierarchy of profiled functions:
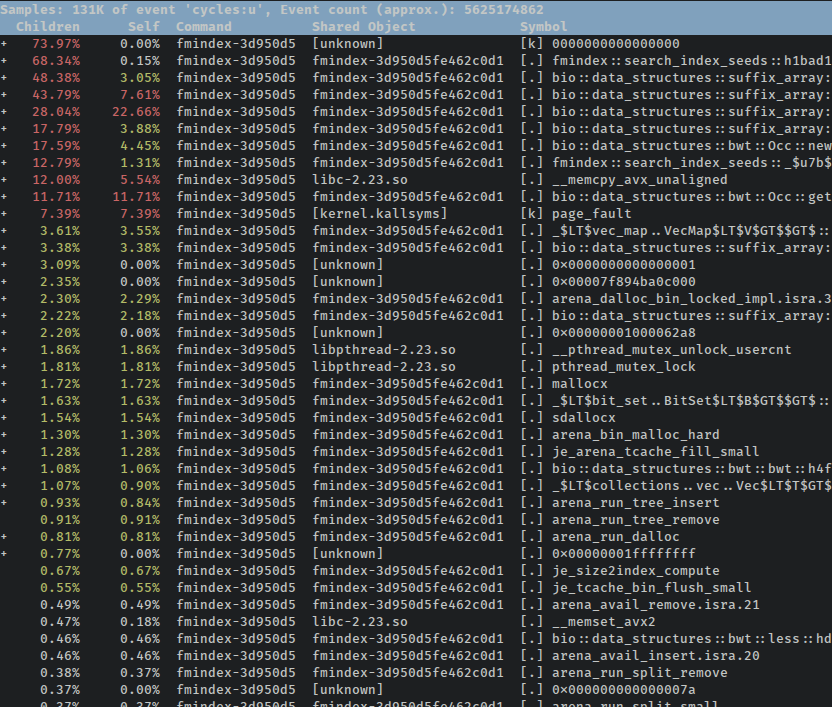
For this particular case, we again run into the problem where the benchmark itself is lost in the code which initializes the indices. There's a very handy --symbol-filter $FILTER flag you can pass to perf report to get the same effect as when we grep'd the collapsed stacks for the flamegraph:
$ perf report --symbol-filter closure
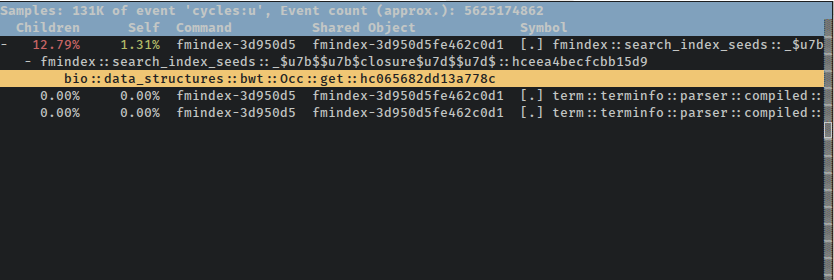
perf also lets us browse annotated source code with the perf annotate command. However, if we want to scope that command's output down to a single function call and its children, we have to know the exact symbol, AFAIK. There's no --symbol-filter flag to pass to annotate, but if you press Enter while the desired function is highlighted in the report TUI, it'll let you choose to open the annotated source for just that function:

The hottest loop in the landahoy
Before going into the annotated source and disassembly of this function: flamegraph has shown that the majority of the benchmark's time is spent in bio::data_structures::bwt::Occ::get. In rust-bio, this type and its method are part of the implementation for an FM Index. This is a super cool data structure which lets one do very efficient lookups for exact matches of a search string in ridiculously large texts. It does so by combining some very interesting properties of a few different indices, one of which is a sampled count of the occurrence of characters in a Burrows-Wheeler Transform (hint: it also involves some dark magicks and blood pacts). It's this sampled data structure (named Occ in rust-bio) which is queried to retrieve the frequency of occurrence of a byte up to a given point in the BWT.
Here's the function in question, as present in rust-bio:
pub fn get(&self, bwt: &BWTSlice, r: usize, a: u8) -> usize {
    // self.k is our sampling rate, so find our last sampled checkpoint
    let i = r / self.k;

    // count all the matching bytes b/t the closest checkpoint and our desired lookup
    // return the sampled checkpoint for this character + the manual count we just did
    self.occ[i][a as usize] +
        bwt[(i * self.k) + 1 .. r + 1].iter()
            .map(|&c| (c == a) as usize).fold(0, |s, e| s + e)
}
It retrieves the sampled count up to that point, and then counts any matching characters in the BWT from the sampled point to the point of our lookup. Here's the baseline performance of this version of the function in the benchmark I wrote to check performance of these FM Index lookups:
$ cargo bench search
...
     Running target/release/fmindex-3d950d5fe462c0d1

running 1 test
test search_index_seeds ... bench:      52,239 ns/iter (+/- 403)
It's worth noting that this runtime is for a full index lookup, not just running the Occ::get function. The benchmark looks up locations for several search strings, and an FM Index may call Occ::get many times for each of those lookups.
Here's a small part of the perf-annotated source of this function, as promised. You can see that perf displays a percentage in the left column (% of total samples for this symbol), highlights common instructions in green, highlights hot instructions in red, and also interleaves the original source with the corresponding assembly where possible:
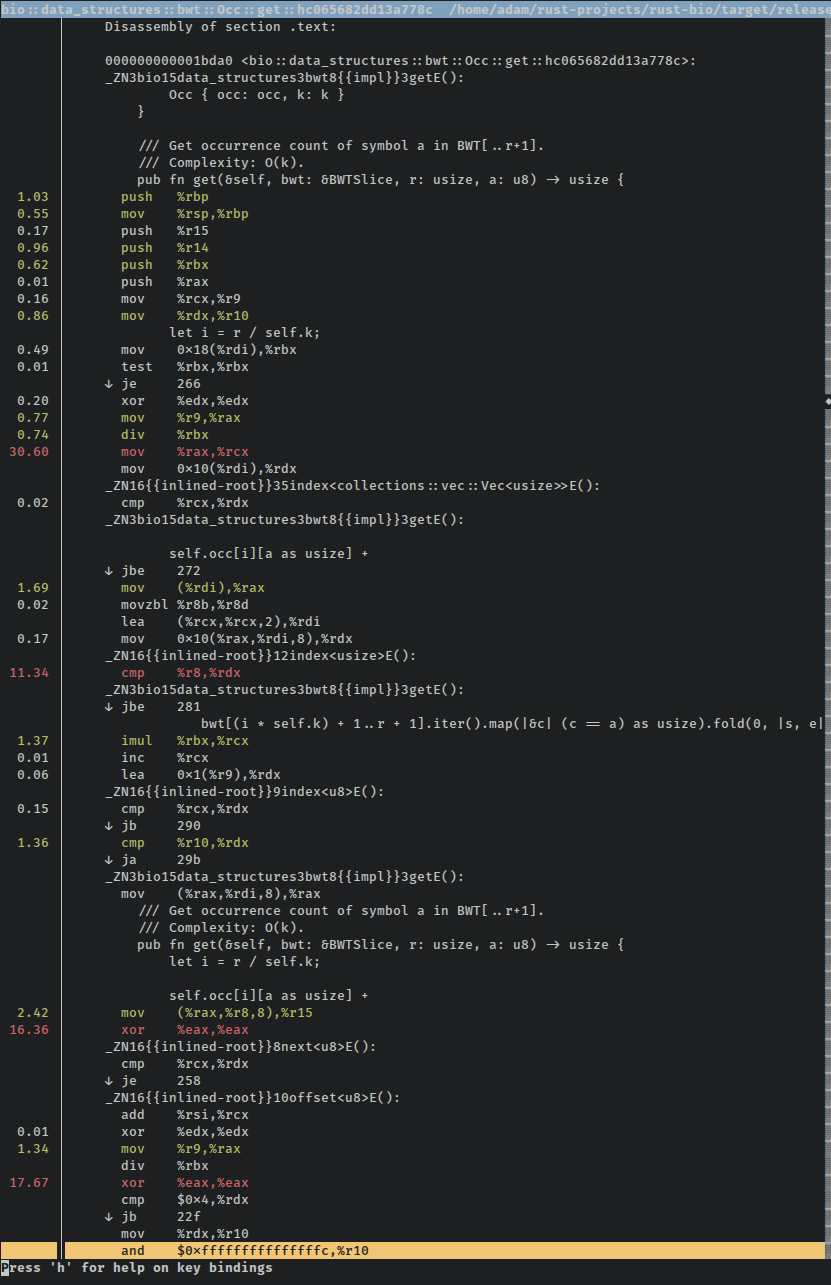
Wait, "a small part"? Yep, there are multiple screens of assembly for what is essentially a lookup in a 2D array followed by a counting loop over a subsection of another array. Something has gone awry!
Everyone (including myself) tells me that Rust iterators are magic, and that combined with LLVM's magic, everything should be monomorphized and const-folded and inlined and loop-hoisted and...I don't actually know how compiler optimizations work. But the general word is that using iterators frequently gives LLVM more than enough information about the loops in question to create screaming fast code based on nice high-level abstractions. And while I may sound a bit sarcastic about this, I have personally measured at least a half a dozen hot loops where Rust's iterator adapters beat my artisinally-handcrafted loops. Granted, I'm not much of a loop hipster, but I've always found that impressive.
Idiomaticity (Idiomatical? Idiomatic-ish?)ahoy
Before the glut of maybe-optimized assembly makes us run in fear of iterator adapters, perhaps there's a better way. For one thing, maping a boolean as an integer, and folding that into an accumulator variable is a slightly peculiar way to count the number of items in a slice which match a predicate. Perhaps Rust/LLVM is just expressing its confusion the only way it knows how? Maybe a slightly more idiomatic set of iterator adapters would be more palatable and would appease the eldritch optimization deities? How about a filter and a count?
pub fn get(&self, bwt: &BWTSlice, r: usize, a: u8) -> usize {
    // self.k is our sampling rate, so find our last sampled checkpoint
    let i = r / self.k;

    // count all the matching bytes b/t the closest checkpoint and our desired lookup
    let count = bwt[(i * self.k) + 1 .. r + 1].iter().filter(|&&c| c == a).count();

    // return the sampled checkpoint for this character + the manual count we just did
    self.occ[i][a as usize] + count
}
Results:
$ cargo bench search
...
     Running target/release/fmindex-3d950d5fe462c0d1

running 1 test
test search_index_seeds ... bench:      34,485 ns/iter (+/- 947)
Since I'm too verbose for you to easily see the numbers from the original version, I'll point out that this is by my count a ~34% speed boost over the previous version, and is an improvement well outside the error bars reported by Rust's benchmark harness.
Huzzah! If we run the benchmark through perf record again, we can pull up the disassembly and see what changed. The disassembly is much much smaller, and there aren't any confusing blocks of many repeated instructions. This is the entire function (omitting the panic handlers just out of the screenshot):
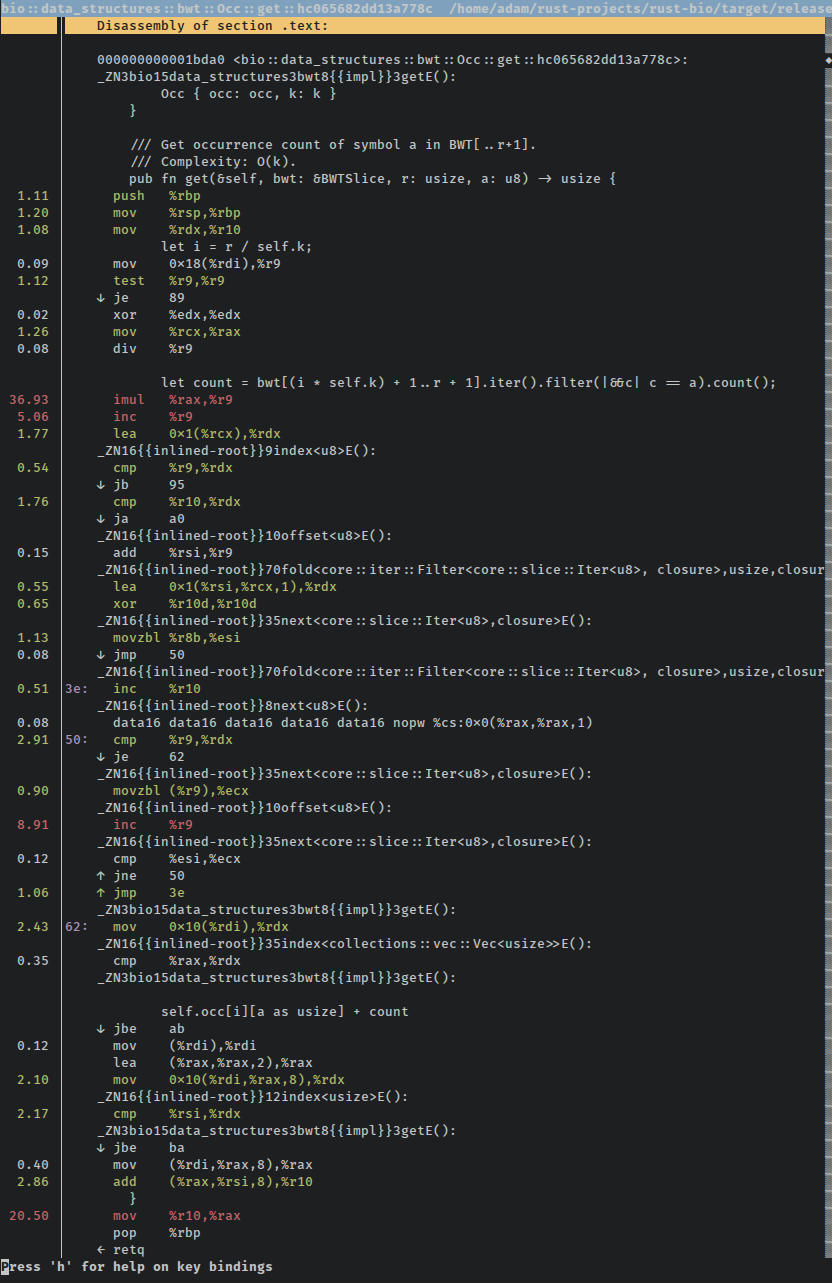
Being able to fit the whole function on one screen is a good sign, right? Our tests are still passing, performance is up, and there are far fewer instructions used for the same functionality, a good sign that previously un-summoned optimizations have burst into the mortal plane to feast on the very essence of our program.
DIYahoy
Maybe we can make this even faster? It's a very hot loop, and any wins here will be of great benefit. Iterator optimizations in Rust are usually pretty great, but maybe manually counting the items will be easier for the optimizer to deal with. How about some good ol' fashioned mutation of a counter variable?
pub fn get(&self, bwt: &BWTSlice, r: usize, a: u8) -> usize {
    // self.k is our sampling rate, so find our last sampled checkpoint
    let i = r / self.k;

    let mut count = 0;

    // count all the matching bytes b/t the closest checkpoint and our desired lookup
    for idx in (i * self.k) + 1 .. r + 1 {
        if bwt[idx] == a {
            count += 1;
        }
    }

    // return the sampled checkpoint for this character + the manual count we just did
    self.occ[i][a as usize] + count
}
Results:
$ cargo bench search
...
     Running target/release/fmindex-3d950d5fe462c0d1

running 1 test
test search_index_seeds ... bench:      35,309 ns/iter (+/- 327)
The difference is well within the error bars for both the "idiomatic iterators" version and this "hipster" version. However, multiple consecutive runs confirm that these averages are fairly stable. So while on some runs this may be faster than the previous version it seems that in general it's probably just a touch slower. Looking at very top of this screenshot of the disassembly, a few percent of the instruction count seems to be spent on comparisons that are for jumps to bounds check panic handlers (perf is cool):
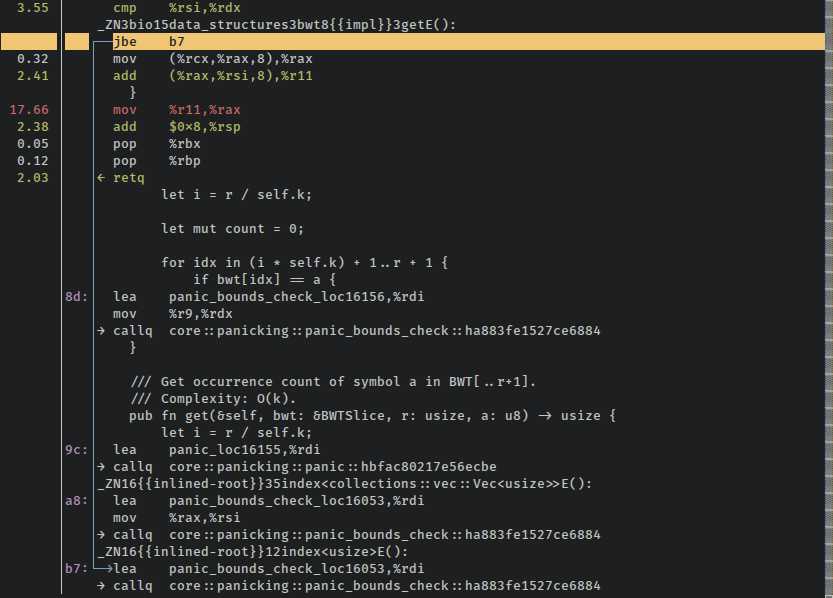
The dreaded bounds check strikes again. It's saving us from reading off the ends of the Vecs which comprise these indices, but it's also costing us cycles.
It's so (bare) metalahoy
What if we use unsafe indexing? We know from the construction of the Vecs and from a bunch of testing that we're not likely to go out of bounds, and if the performance is good enough we can always go back and add in an assert to the start of the function. Maybe if we use some judicious unsafe to skip bounds checks, we'll trim off that few percent?
pub fn get(&self, bwt: &BWTSlice, r: usize, a: u8) -> usize {
    // self.k is our sampling rate, so find our last sampled checkpoint
    let i = r / self.k;

    let mut count = 0;

    // count all the matching bytes b/t the closest checkpoint and our desired lookup
    for idx in (i * self.k) + 1 .. r + 1 {
        unsafe {
            if *bwt.get_unchecked(idx) == a {
                count += 1;
            }
        }
    }

    // return the sampled checkpoint for this character + the manual count we just did
    unsafe {
        self.occ.get_unchecked(i).get_unchecked(a as usize) + count
    }
}
Results:
$ cargo bench search
...
     Running target/release/fmindex-3d950d5fe462c0d1

running 1 test
test search_index_seeds ... bench:      46,067 ns/iter (+/- 238)
This is...much worse than either of the improvements we've made, and is definitely outside of the error tolerance of these benchmarks.
Holy cow! What happened? It looks like the optimizer didn't do too hot here. The disassembly has a lot of instructions that weren't necessary or useful in the safe version of this function, and looks quite similar to the original version, just without calls to the iterator functions:
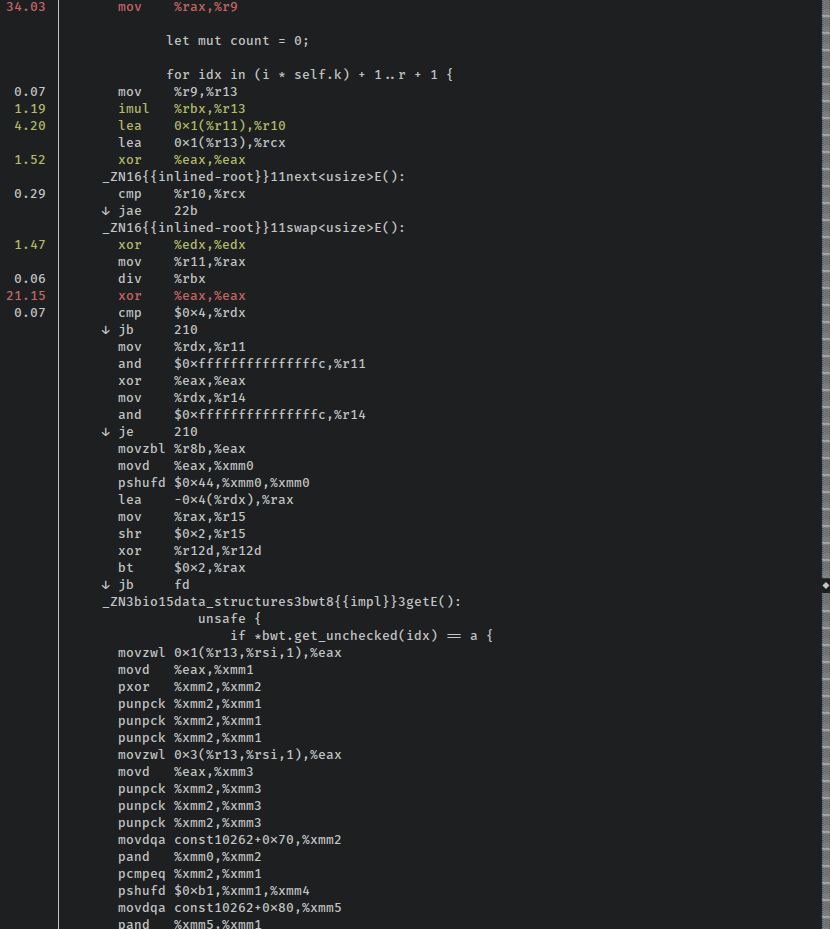
Important note: whenever someone like me is advocating for Rust and tells you that you "can always remove the bounds checks in hot loops," remind them that in some cases that might not help. I haven't exhaustively dug through the Rust issue tracker to see if this is a bug, so maybe it's already being addressed. Regardless, removing the bounds checks is not a big red magic "go faster" button, and as I may have mentioned, you absolutely have to measure the performance implications of "obvious" changes.
Also interesting, when I try the bounds-checked indexing version in my larger program, it sometimes performs a few percent better than the idiomatic iterator example! Go figure -- the summoning rituals for optimizations are arcane and fraught with nuance and danger. The unchecked indexing version still underperforms there, and I suspect that Rust could probably output better non-bounds-checked LLVM IR, or register different LLVM passes or something, but I'm so not an expert here it's not remotely funny.
Pull Requestahoy
Open source is fantastic! Not only did I not have to write all of these data structures myself, but I am also able to share any improvements I make with anyone else who uses them. The pull request has been merged, and the performance improvement should be available on crates.io soon.
While for my use case the performance is sometimes just a bit better when using the version with artisinal bounds-checked indexing (as opposed to iterator adapters), since I don't have evidence that it would be beneficial for other applications I didn't think it wise to upstream.
Parting thoughtsahoy
Profiling tools are cool! This would have been much harder to investigate without sophisticated tooling. For one thing, just discovering that the Occ::get function was eating up so much time would not have been feasible. Further, viewing in detail the effects of changes to it would have been difficult at best. Finally, understanding the nature of slowdowns/speedups is invaluable for future optimization efforts.
Performance of generated code is always going to be a little in flux. And right now there's a lot of attention paid to compiler performance, but AFAIK there's no effort yet to systematically track the performance of compiled Rust programs. I've poked around with that before and didn't get very far, there's the I-slow label for issues which gets a lot of attention (so open one if you find bad codegen), as well as a tracking issue for building a perf regression test suite which may or may not be progressing.
I am told that whenever MIR gets turned on by default it will enable new optimizations to occur in the Rust front-end before any LLVM IR is generated. This could radically change what sort of manual optimizations have an impact. I tried running these benchmarks with RUSTFLAGS="-Z orbit" and didn't see a difference. Assuming I used the correct flag (ha!), MIR trans behaves similarly to the default codegen for this case...for now.
I completely forgot to include measurements or screenshots, but when I tried manually iterating over the slice (not using iterator adapters, but also not using manual indexing), I didn't achieve any significant performance boost over the manually indexed version shown here. It certainly bears further investigation. (it looks like this is probably due to poorly performing vectorization, see Update below)
If you're writing performance critical code, take it with a grain of salt when Rustaceans tell you that Vec::get_unchecked should improve performance. Obviously it's true in many cases (including ones I've recently worked on), but measure, measure...oh I'm tired of writing that.
Update (7/25/16)ahoy
On /r/rust, /u/Aatch did some very in-depth analysis of the assembly output (beyond my ken) and came up with some very interesting conclusions. Essentially, removing the bounds checks actually allows the loop to be vectorized, and it's the SIMD version which ends up so much slower.
I missed the fact that the documentation examples I copy-pasta'd for the benchmark I used a very low value for k in Occ. So when LLVM was able to vectorize the function, the vectorized version was always called on inputs too small to take advantage of vectorized sums when manually counting the BWT.
Now, this would be an interesting oddity (isn't it crazy that optimizations made this so much slower?), except for the fact that k=3 is much lower than typical real-world usage, AFAICT. One C++ application I frequently see used defaults to k=32, and I've been tinkering with the tradeoffs of much higher sampling rates like 128 or 256. Turns out, the vectorized version is wicked fast (even with safe code) once you up the sample rate past 32. I've opened a PR to discuss these tradeoffs.
I don't think this changes the usefulness of demonstrating how to use these tools with Rust, but it definitely puts some egg on my face! And it definitely underscores the important of measuring intelligently, and double-checking one's assumptions!
Feedback?ahoy
Much thanks to pczarn and curtism in #rust-offtopic for kindly taking the time to read this and providing very useful edits.
Contact links are in the footer below. I’m usually in #rust on irc.mozilla.org as anp.
I also posted this to Hacker News and the /r/rust subreddit if you'd like to discuss it either of those places.
EDIT: My post to HN didn't really get anywhere, but it looks like it's been resubmitted.

